|
|
Using AnyChart in your Flash ActionScript 3.0 projects (Flash CS3, CS4)AnyChart Flash Charting Component is a flexible Adobe Flash based solution that allows you to create interactive and great looking flash charts and dashboards. It is a cross-browser and cross-platform charting solution intended for everybody who deals with creation of dashboard, reporting, analytics, statistical, financial or any other data visualization solutions. Please see more information about AnyChart at: A lot of technologies allow developers to use Flash based products, but there are specific issues in each case. AnyChart Team have tried to creates samples that make the start of implementation of AnyChart easier and understandable. This particular sample explains how to use AnyChart Flash Charts, Maps, Gauges and Dashboards with Flash CS3, CS4.
If you want to use AnyChart with Flash CS3, CS4 you can start with downloading the following samples package: AnyChart For Flash CS 3, CS 4 Integration Package These are samples of AnyChart Flash Charts usage with AS3, please download the zip file and unpack it. IntroductionAnyChart for Flash CS3, CS4 is not a native Flash CS3, CS4 Component - it is just a set of classes that allow you to load AnyChart.swf into your project and use it to create charts in your Flash CS3, CS4 application. Although this method has some disadvantages - you can utilize the full power of AnyChart Charts, Gauges, Maps and all other chart types and get the great results and artistic visualization along with the number of useful features of AnyChart. The tutorial below will guide you through all basic steps you need to know to start using AnyChart in Flash CS3. Your First ChartLets see how to add chart into your Flash Application. Create a .fla file and name it, for example, "FirstChart.fla". Copy the contents of src folder into the folder where "FirstChart.fla" is saved. You should see the following file structure within your folder:
In the first frame add the following code:
import com.anychart.flash9.AnyChart;
import flash.display.StageScaleMode; import flash.display.StageAlign; AnyChart.loadEngine(); this.stage.scaleMode = StageScaleMode.NO_SCALE; this.stage.align = StageAlign.TOP_LEFT; var chart:AnyChart = new AnyChart(); chart.chartWidth=400; chart.chartHeight=300; this.addChild(chart); As the result you should see the following: 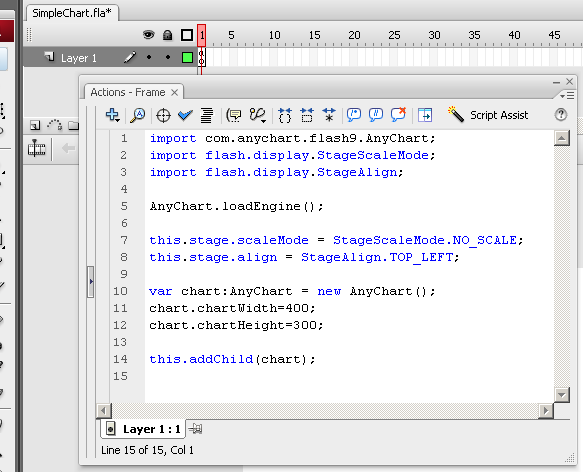
Live Sample: Simple Chart Download Sample: Simple Chart Source Code
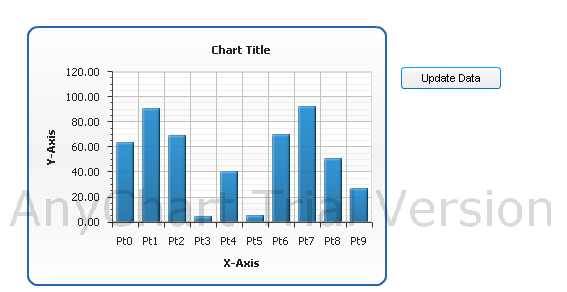
Working with dataTo make you chart show something more than "Waiting for data" you have to pass it the data in AnyChart XML format - as a string or as a file, with the help of setXMLData and setXMLFile methods, respectively. AnyChart XML is the special format of chart data and visualization description, to learn more about it please refer to: Assuming you know basics of AnyChart XML, add the following code:
chart.addEventListener(EngineEvent.ANYCHART_CREATE, onEngineCreate);
function generateData():XML { var res:XML = <anychart> <charts> <chart> <data> <series name="series1"> </series> </data> </chart> </charts> </anychart>; for (var i:int = 0;i<10;i++) { res.charts[0].chart[0].data[0].series[0].point += <point name={"Pt"+i.toString()} y={Math.random()*100} />; } return res; }; function onEngineCreate(e:EngineEvent):void {chart.setXMLData(generateData());} Live Sample: Simple Chart With Data Download Sample: Simple Chart With Data Source Code
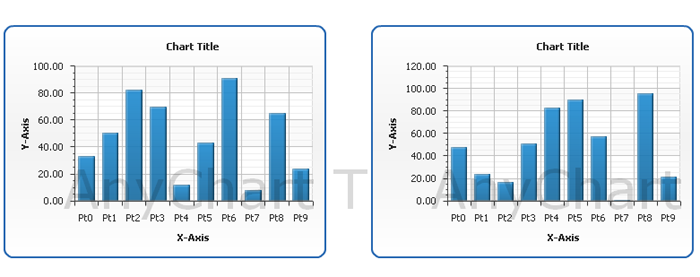
Multiple Charts on one stageYou can add several charts into one stage to create a dashboard or just show several charts at once, to add this - just declare and create it, place it where you want and pass the data:
var chart2:AnyChart = new AnyChart();
chart2.x = 410; chart2.chartWidth = 400; chart2.chartHeight = 300; chart.addEventListener(EngineEvent.ANYCHART_CREATE, onEngineCreate); function generateData():XML { var res:XML = <anychart> <charts> <chart> <data> <series name="series1"> </series> </data> </chart> </charts> </anychart>; for (var i:int = 0;i<10;i++) { res.charts[0].chart[0].data[0].series[0].point += <point name={"Pt"+i.toString()} y={Math.random()*100} />; } return res; }; function onEngineCreate(e:EngineEvent):void { chart.setXMLData(generateData()); chart2.setXMLData(generateData()); } Live Sample: Multiple Charts Download Sample:Multiple Charts Source Code
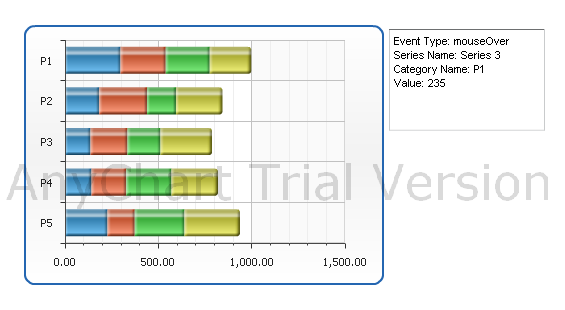
Processing events from chartsTo handle events from charts created with AnyChart.swf you have to add this declaration:
import com.anychart.flash9.events.AnyChartPointEvent;
As soon as you have done this - you can handle the following events:
To handle the event you have to create a listener and assign event handler. You can do this in the following way:
chart.addEventListener(AnyChartPointEvent.MOUSE_OVER, onMouseOver);
function onMouseOver(event:AnyChartPointEvent){ trace ("Mouse Over"); } Live Sample: Events Sample Download Sample: Events Sample Source Code
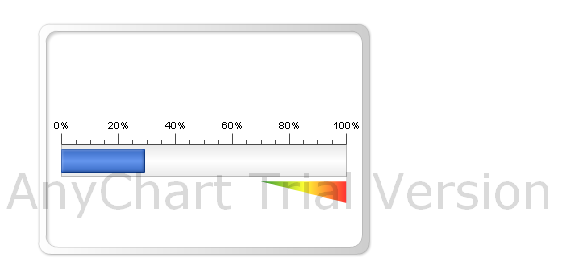
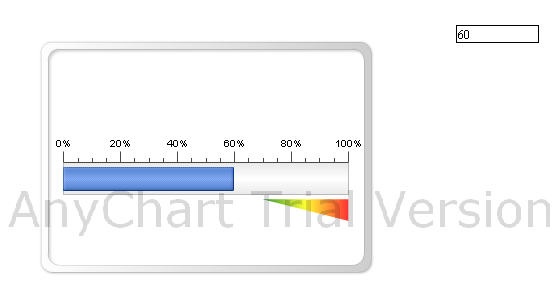
Gauges and Gauges EventsIf you would like to add Gauges into you Flash CS3 application - you should do all the same things, but XML should contain Gauges data (Refer to AnyChart Users Guide and XML Reference to know how Gauges XML looks like). The special things about gauge is the fact that you can update the color and the value of Gauge Pointer dynamically, without recreating the chart. If you need this in your application - use updatePointerData(gaugeName:String, pointerName:String, pointerValue:Number) and updatePointerColor(gaugeName:String, pointerName:String, pointerColor:String) methods. Lets create the sample where linear Gauge gets random value according to timer: import com.anychart.flash9.AnyChart; this.stage.scaleMode = StageScaleMode.NO_SCALE; var chart:AnyChart = new AnyChart(); chart.setXMLData(generateData()); function setXML(e:Event):void { function updateData(e:Event):void { var timer:Timer = new Timer(10000); timer.start(); function generateData():XML{ return res; this.addChild(chart); AnyChart.loadEngine(); Live Sample: Gauges Sample with dynamic data update Download Sample: Gauges Sample with dynamic data update Source Code
When you use Gauges you can handle Gauge pointer events. To do this add this code:
import com.anychart.flash9.events.ValueChangeEvent;
chart.addEventListener(ValueChangeEvent.VALUE_CHANGE,getValue); function getValue(e:ValueChangeEvent):void { var value:Number = Math.ceil(e.params.pointerValue); trace (value.toString()); } Live Sample: Gauges Sample with ValueChangeEvent Download sample: Gauges Sample with ValueChangeEvent Source Code
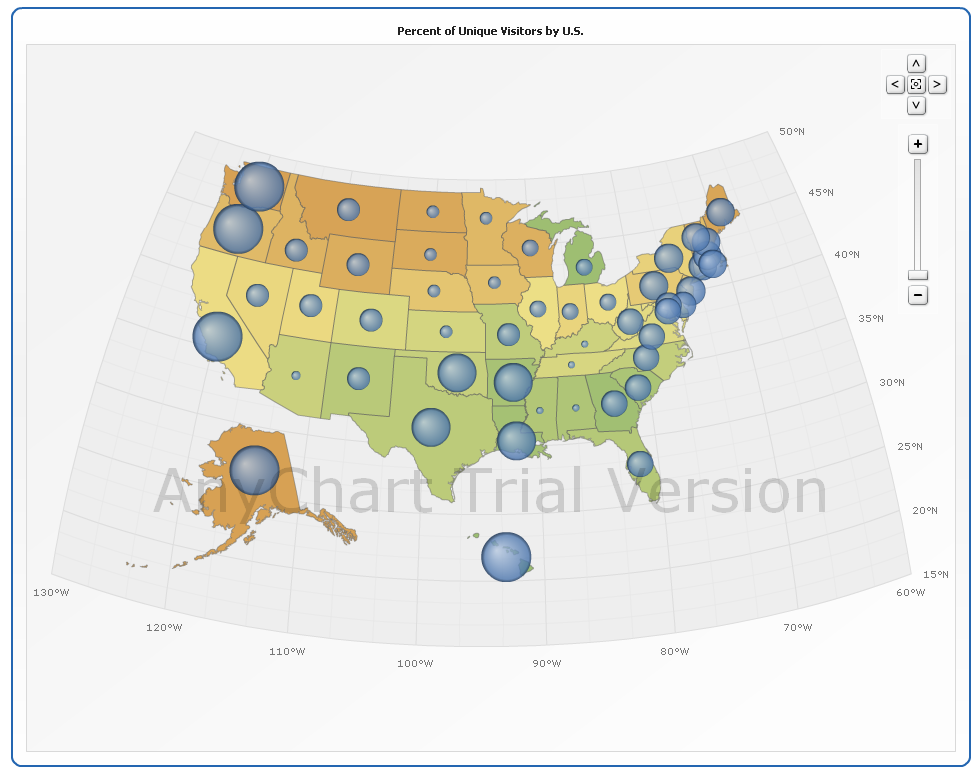
Using MapsIf you want to create a map with AnyMap extension of AnyChart Flash Chart Component you have to add amap file with map data. By default maps are stored in "maps" folder located in the same folder where AnyChart.swf. Then you just pass XML that configures the map and enjoy the interactive map. Sample Code to add (assumes amap file is placed to the proper place):
import com.anychart.flash9.AnyChart;
import com.anychart.flash9.events.EngineEvent; import flash.display.StageScaleMode; import flash.display.StageAlign; this.stage.scaleMode = StageScaleMode.NO_SCALE; this.stage.align = StageAlign.TOP_LEFT; var chart:AnyChart = new AnyChart(); chart.chartWidth=1000; chart.chartHeight=800; chart.enableXMLCache(); chart.setXMLFile("./anychart.xml"); this.addChild(chart); AnyChart.loadEngine(); Live sample: AnyMap Sample Download sample: AnyMap Sample Source Code
AfterwordThe source code for all samples can be found in the downloadable package in files with ".fla" extension. To learn more about AnyChart, get User's Guide and XML Reference:
|