Adaptive Moving Average (AMA)
Overview
An Adaptive Moving Average (AMA) is one more moving average overlay, just like EMA. It changes its sensitivity to price fluctuations. The Adaptive Moving Average becomes more sensitive during periods when price is moving in a certain direction and becomes less sensitive to price movement when price is volatile.
AnyChart Stock allows you to add AMA with desired period to any of your charts.
Mathematical description of the indicator please see at: Mathematical Description of Technical Indicators

Adding indicator
To add any indicator to the chart, you need to use Data Provider with the fields required by the indicator.
When such Data Provider is ready - you can add indicator to the chart.
Preparing Data Provider
AMA indicator needs Data Provider with Value or Close fields.
Sample XML of Data Provider, which can be used to create AMA indicator:
In case if you use Data Provider for OHLC or Candlestick, XML looks like that:
Indicator Declaration
As soon as Data Provider is ready you can add it to the chart.
AMA indicator is usually used as an Overlay indicator and displayed on the same chart with data series (stock data). So we should declare it in the chart where series is displayed.
XML for AMA declaration:
As you can see AMA type is set to indicator using type attribute, and data_provider attribute specifies Data Provider with series and indicator data.
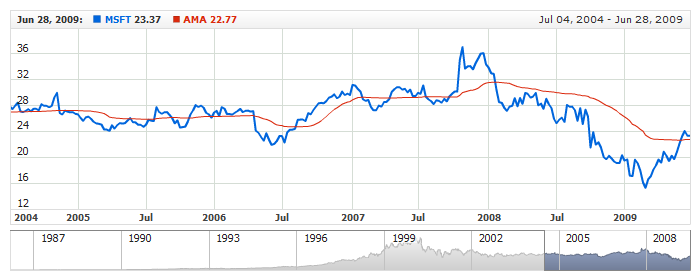
Live sample of the chart with AMA indicator:
Live Sample: Technical Indicators - Adding AMA to a Chart
Indicator parameters
Adaptive Moving Average Indicator has three type-specific parameters - period, fast period and slow period. All of them are set in <ama_indicator> node, where all settings for AMA indicator are set.
XML for setting AMA period:
As you can see you just need to set period, fast_period and slow_period attributes in <ama_indicator> node, these attributes accept any integer greater than 1.
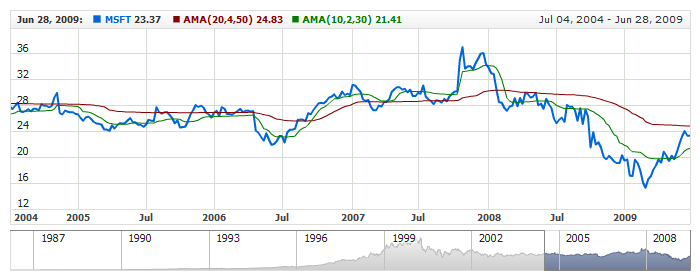
Live sample below shows two AMAs: AMA(20,4,50) and AMA(10,2,30):
Live Sample: Technical Indicators - AMA Parameters
Visualization
To visualize and tune visualization of technical indicators AnyChart Stock Component uses the same methods as for the data series.
By default AMA is shown as series of Line type, but you can use almost any of available series types to show it on the chart - Spline, Area or Stick, for example.
AMA indicator settings are contained in <ama_indicator> node, also in this node you can put <series> subnode - this node defines how exactly indicator is displayed on the chart. This node is identical to <series> node used to describe data series, so you can do with indicator anything you can do with series.
Sample XML for changing indicator visualization:
05 |
<name><![CDATA[AMA(10,2,30)]]></name> |
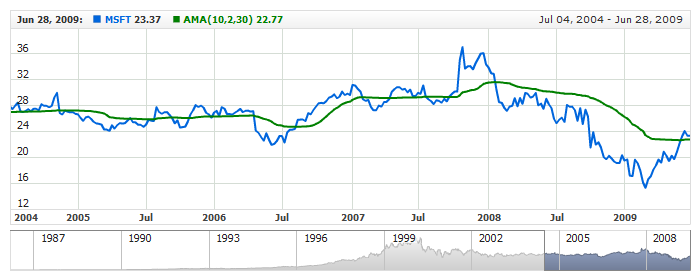
As you can see we set period, color, series type is set to Spline, line width is set to 2px, and name is set to "AMA(10,2,30)".
Live sample below shows settings described above:
Live Sample: Technical Indicators - AMA Visualization Settings
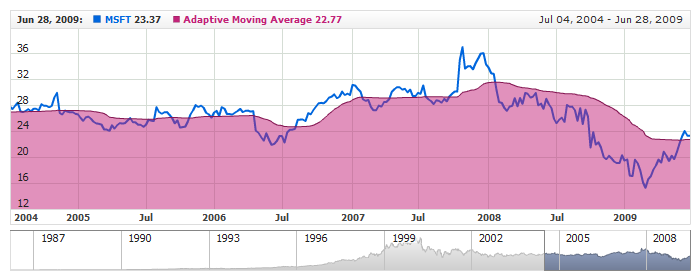
Another example of changing visualization of AMA indicator - it is shown as SplineArea:
Live Sample: Technical Indicators - Show AMA as SplineArea