<html>
<head>
<title>Series comparison modes</title>
<meta http-equiv="content-type" content="text/html; charset=utf-8" />
<script type="text/javascript" language="javascript" src="./../js/AnyChartStock.js?v=1.9.0r9317"></script>
<script type="text/javascript" language="javascript" src="./js/jquery.min.js"></script>
<!-- chart size settings -->
<style type="text/css">
#chartContainer {
width: 800px;
height: 550px;
float: left;
}
</style>
<script type="text/javascript" language="javascript">
// Creating new chart object.
var chart = new AnyChartStock("./../swf/AnyChartStock.swf?v=1.9.0r9317", "./../swf/Preloader.swf?v=1.9.0r9317");
// Setting XML config file.
chart.setXMLFile("config.xml");
// needConfig set to true allowas to work with chart objectModel
chart.needConfig = true;
// Writing the flash object into the page DOM.
chart.write("chartContainer");
// Current base series
var lastSelectedSeries = "CSCO";
//--------------------------------------------------------------------------------
// Initialization
//--------------------------------------------------------------------------------
chart.onChartDraw = function() {
// base series selector options
showBaseSeriesOptions();
// series show/hide checkboxes
showSeriesCheckboxes();
// value scale mode
checkValueScaleMode();
chart.onChartDraw = null;
// apply base changes
chart.applySettingsChanges();
}
//--------------------------------------------------------------------------------
// Interface updating
//--------------------------------------------------------------------------------
// Base series select. Get series from objectModel and show them in <select id="baseSeries"></select>
function showBaseSeriesOptions() {
var seriesList = chart.getChartById("idMainChart").seriesList; // series array
var scrollerSources = document.getElementById("baseSeries"); // target <select />
for (var i = 0;i<seriesList.length;i++) {
var opt = document.createElement("option"); // create <option />
opt.innerText = seriesList[i].name; // option text is series name (for IE)
opt.text = seriesList[i].name; // option text is series name (for other browsers)
opt.value = seriesList[i].name; // option value is series name
if (seriesList[i].name == lastSelectedSeries) // selected if id is equal to lastSelectedSeries
opt.selected = true;
scrollerSources.appendChild(opt); // add option to <select />
}
}
// series show/hide checkboxes
function showSeriesCheckboxes() {
var html = "";
var seriesList = chart.getChartById("idMainChart").seriesList; // series array
for (var i = 0;i<seriesList.length;i++) {
if (seriesList[i].name == lastSelectedSeries) // if series is base - don't show it in checkboxes
continue; //skip selected
// create <input type='checkbox' /> for showing/hiding series
html += "<input type='checkbox' id='"+seriesList[i].id+"' "+(seriesList[i].enabled ? "checked='true'":"")+ " onclick='showHideSeries(\""+seriesList[i].id+"\")' /><label for='"+seriesList[i].id+"'><font color='"+seriesList[i].color+"'><strong>"+seriesList[i].name+"</strong></font></label><br />";
}
// show <input />
$("#series").html(html);
}
//--------------------------------------------------------------------------------
// Show/Hide series
//--------------------------------------------------------------------------------
// Function to show/hide series by id
function showHideSeries(id) {
chart.getSeriesById("idMainChart",id).enabled = $("#"+id).get(0).checked; // update enabled flag
checkValueScaleMode(); // update value scale mode (comparision or values)
chart.applySettingsChanges(); // apply changes
}
//--------------------------------------------------------------------------------
// Switch base
//--------------------------------------------------------------------------------
// update base series
function switchBaseSeries() {
chart.getSeriesById("idMainChart","id"+lastSelectedSeries+"Series").enabled = false; // hide current base series
lastSelectedSeries = $("#baseSeries").val(); // get new base series name
chart.getSeriesById("idMainChart", "id"+lastSelectedSeries+"Series").enabled = true; // show new base series
chart.objectModel.settings.scroller.dataProvider = "idScrollerDataProvider" + lastSelectedSeries; // switch scroller data provider for the new one
var newSeriesList = [];
var seriesList = chart.getChartById("idMainChart").seriesList;
newSeriesList.push(chart.getSeriesById("idMainChart", "id"+lastSelectedSeries+"Series"));
for (var i = 0;i<seriesList.length;i++) {
if (seriesList[i].id != "id"+lastSelectedSeries+"Series")
newSeriesList.push(seriesList[i]);
}
chart.getChartById("idMainChart").seriesList = newSeriesList;
showSeriesCheckboxes(); // update series checkboxes
checkValueScaleMode(); // check value scale mode (comparision or values)
switchScrollerColorScheme(lastSelectedSeries); // update scroller series colors
chart.applySettingsChanges(); // apply settings changes in objectModel
}
// Function to update scroller color depending on the base series.
function switchScrollerColorScheme(seriesName) {
// get object with settings
var insideSelectedRange = chart.objectModel.settings.scroller.insideSelectedRange;
// set fill opacity
insideSelectedRange.seriesFill.opacity = 0.5;
// set color and gradient
switch (seriesName) {
case "CSCO":
insideSelectedRange.seriesLine.color = "#5A92D5";
insideSelectedRange.seriesFill.gradient.keys[0].color = "#ABBDE3";
insideSelectedRange.seriesFill.gradient.keys[1].color = "#0066DD";
break;
case "MSFT":
insideSelectedRange.seriesLine.color = "#D37963";
insideSelectedRange.seriesFill.gradient.keys[0].color = "#DFA79A";
insideSelectedRange.seriesFill.gradient.keys[1].color = "#DC3912";
break;
case "ORCL":
insideSelectedRange.seriesLine.color = "#E4AC5A";
insideSelectedRange.seriesFill.gradient.keys[0].color = "#E9C796";
insideSelectedRange.seriesFill.gradient.keys[1].color = "#FF9900";
break;
case "IBM":
insideSelectedRange.seriesLine.color = "#5B8E10";
insideSelectedRange.seriesFill.gradient.keys[0].color = "#B5C89A";
insideSelectedRange.seriesFill.gradient.keys[1].color = "#5B8E10";
break;
}
}
//--------------------------------------------------------------------------------
// Comparision modes
//--------------------------------------------------------------------------------
// update interface
function checkValueScaleMode() {
var c = chart.getChartById("idMainChart"); // link to the chart
var seriesList = c.seriesList; // list of the series
var visibleCount = 0; // number of visible series
for (var i = 0;i<seriesList.length;i++)
if (seriesList[i].enabled) visibleCount++;
if (visibleCount > 1) { // if there are more than one visible series
updateComparisionMode(); // switch to comparison mode
$("#comparisionMode").removeAttr("disabled"); // allow changing comparison modes (Changes or Percent changes)
}else { // if there is only one series shown - set values show mode
// axis settings
var primaryAxis = c.valueAxes.primary; // link to axis settings
primaryAxis.labels.format = "{%Value}{numDecimals:2,trailingZeros:false}"; // labels format
primaryAxis.labels.font.color = "#333333"; // labels font color
primaryAxis.scale.mode = "Values"; // scale mode - Values
// legend labels formatting
var focusSettings = c.legend.labels.focusSettings;
// hover format
focusSettings.mouseOver.format = "{%SeriesIcon} <b><font color=\"%Color\">{%SeriesName}</font> {%Value.Current}{numDecimals:2,trailingZeros:false}</b> ";
// mouse out format
focusSettings.mouseOut.format = "{%SeriesIcon} <b><font color=\"%Color\">{%SeriesName}</font> {%Value.LastVisible}{numDecimals:2,trailingZeros:false}</b> ";
// disable comparision mode settings
$("#comparisionMode").attr("disabled","disabled");
}
}
// update settings depending on the mode - changes или percent changes
function updateComparisionMode() {
var c = chart.getChartById("idMainChart");
var primaryAxis = c.valueAxes.primary; // link to axis settings
var focusSettings = c.legend.labels.focusSettings; // legend labels formatting
primaryAxis.labels.font.color = "%Color"; // color labels depending on the values - positive, negative or zero
if ($("#comparisionMode").val() == "%Changes") { // Percent changes
primaryAxis.scale.mode = "PercentChanges"; // scale mode - Percent changes
primaryAxis.labels.format = "{%Value}{numDecimals:2,trailingZeros:false,plusSign:true}%"; // format axis labels: {%Value}{numDecimals:0}%.
// hover format
focusSettings.mouseOver.format = "<textformat tabstops=\"[100]\">{%SeriesIcon} <b><font color=\"%Color\">{%SeriesName}: </font><font color=\"%ChangeColor.Current\">{%PercentValueChange.Current}{numDecimals:2,plusSign:true}%</font></b><tab/></textformat>";
// normal format
focusSettings.mouseOut.format = "<textformat tabstops=\"[100]\">{%SeriesIcon} <b><font color=\"%Color\">{%SeriesName}: </font><font color=\"%ChangeColor.LastVisible\">{%PercentValueChange.LastVisible}{numDecimals:2,plusSign:true}%</font></b><tab/></textformat>";
}else {
c.valueAxes.primary.scale.mode = "Changes"; // scale mode - Changes
c.valueAxes.primary.labels.format = "{%Value}{numDecimals:2,trailingZeros:false,plusSign:true}"; // axis labels format: {%Value}{numDecimals:0}
// hover format
focusSettings.mouseOver.format = "<textformat tabstops=\"[80]\">{%SeriesIcon} <b><font color=\"%Color\">{%SeriesName}: </font><font color=\"%ChangeColor.Current\">{%ValueChange.Current}{numDecimals:2,plusSign:true}</font></b><tab/></textformat>";
// normal format
focusSettings.mouseOut.format = "<textformat tabstops=\"[80]\">{%SeriesIcon} <b><font color=\"%Color\">{%SeriesName}: </font><font color=\"%ChangeColor.LastVisible\">{%ValueChange.LastVisible}{numDecimals:2,plusSign:true}</font></b><tab/></textformat>";
}
}
// handler comparision mode changes
function changeComparisionMode() {
updateComparisionMode(); // set new config to the chart
chart.applySettingsChanges(); // apply changes
}
//---------------------------------------------------------------------------------------------------
// html events binding
//---------------------------------------------------------------------------------------------------
$(function() {
$("#baseSeries").change(switchBaseSeries);
$("#comparisionMode").change(changeComparisionMode);
});
</script>
<!-- style settings -->
<style type="text/css">
table.settings {
border-style: solid;
border-width: 1px;
border-color: #D0CDC9;
width: 200px;
}
table.settings tr th {
font:normal 60% Verdana;
background-color: #DCD9D5;
font-weight:bold;
padding-bottom:5px;
padding-top:5px;
padding-left:10px;
padding-right:10px;
text-align:left;
}
table.settings tr td {
background-color: #F8F4F0;
font:normal 70% Verdana;
padding-bottom:2px;
padding-top:2px;
padding-left:10px;
padding-right:10px;
text-align:left;
}
table.settings select {
width: 100%;
}
</style>
</head>
<body>
<div id="chartContainer"><!-- Chart Container --></div>
<table>
<tr>
<td valign="top">
<table class="settings">
<tr>
<th width="60px">Compare:</th>
<td>
<select id="baseSeries" autocomplete="off"></select>
</td>
</tr>
<tr>
<th>To:</th>
<td id="series"></td>
</tr>
</table>
<br />
<table class="settings">
<tr><th>Comparison Mode:</th></tr>
<tr>
<td>
<select id="comparisionMode" disabled="disabled" autocomplete="off">
<option value="Changes" selected="selected">Changes</option>
<option value="%Changes">%Changes</option>
</select>
</td>
</tr>
</table>
</td>
</tr>
</table>
</body>
</html>Sample Description
How to use this sample?
Use the controls to the right of the chart to select series to compare and comparison mode.
How it works
This sample shows how to make chart show so-called comparison chart, rather popular and useful way to show financial data. All controls are custom HTML controls and the chart is controlled using Object Model modifications. Let's see in details what happens here and how it is done:
When you load the chart you see four series on the chart, one of them is base and is always shown, and three others are compared to it and can be shown or hidden. Also, there is a combobox control, which allows you to change axis mode and show changes in percents or in absolute values.
Show/Hide Series to which main is Compared
Showing/hiding series is done by altering their enabled attribute (as shown in Show/Hide Series sample): getSeriesById method is used to obtain link to series and enabled attribute is set as needed.
Note: if you hide all series to compare and leave only base series displayed - chart is switched to "Changes" mode.
Change Comparison Scale
Changing scale mode is done via object model too, but includes several modifications: you need not only to change scale mode, but also have to modify legend and labels format - to make visualization proper. Illustration below marks these visual elements and how these changes are done you can see in updateComparisionMode function in source code:

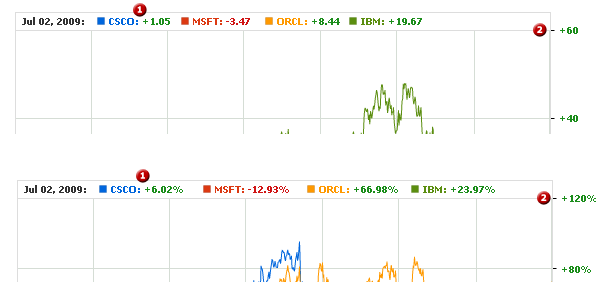
Switching Main Series
Combobox is used to switch base series - when you do so switchBaseSeries function is called and several actions are performed: list of checkboxes is recreated, series list in the component is rearranged, so the base series is displayed in the legend first and Scroller Data Provider is switched to and Scroller Thumbnail series is recolored.
Scroller Data Provider
Scroller can show thumbnail series in background to make navigation easier and many more other features, which you can learn from Scroller section. In this sample scroller data provider is switched when base series is changed - to show base series thumbnail in scroller, and this thumbnail is recolored. Scroller data provider is switched in switchBaseSeries function and coloring is changed in switchScrollerColorScheme function. Illustration below shows how scroller changes when different providers and colors are set:

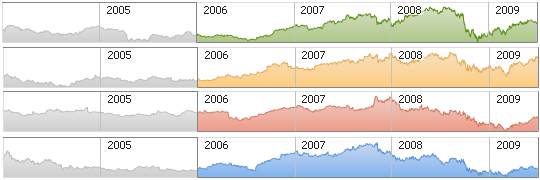
Note: in this sample we have made switching data provider easy with a little trick - config.xml contains four predefined and ready to use scroller data providers and we just change the name in dataProvider attribute. Read more about scroller data provider in Scroller Data Provider article and note, that this approach (creating predefined data providers) may not be applicable in real application.
AnyChartStock JavaScript API
This sample uses the following methods, properties and events from AnyChartStock JavaScript API:
| Item | Type | Description |
|---|---|---|
| needConfig | Property (Boolean) | Defines whether the access to full chart configuration object model is required. |
| objectModel | Property (Object) | Gets chart configuration as an Object. |
| applySettingsChanges | Method | Commits changes made to settings element of the objectModel. |
| getChartById | Method | Returns link to a chart object in the objectModel. |
| getSeriesById | Method | Gets series object from the object model by its id. |
| setXMLFile | Method | Sets chart XML configuration file path. |
| write | Method | Adds the chart to HTML DOM as a child of the specified container. |
| onChartDraw | Event | This event is dispatched when the AnyChart Stock is drawn. |
Prerequisites
This section lists all configuration, data and auxiliary files required for this sample.
Configuration file
CSV files
SWF files
- AnyChartStock.swf - AnyChart Stock component.
- Preloader.swf - AnyChart Stock helper component that loads the main component (AnyChartStock.swf) and displays loading progress.
JavaScript Libraries
- jquery.min.js - A JavaScript jQuery library. Learn more at jQuery official site.
- AnyChartStock.js - A JavaScript library that is shipped with AnyChart Stock component. It is used to embed the component into HTML DOM and to comunicate with the Flash part.
The information contained in this website is for general information purposes only. All sample data provided on this site is for demonstration purposes only.
The logos and names of other companies and products mentioned on this site are copyright and/or trademarks of their respective owners.
The content on this site, including news, quotes, data and other information, is provided for your personal information only, and is intended for demonstration purposes only. Content on this site is not appropriate for the purposes of making a decision to carry out a transaction or trade. Nor does it provide any form of advice (investment, tax, legal) amounting to investment advice, or make any recommendations regarding particular financial instruments, investments or products.
In no event AnyChart will be liable for any loss or damage including without limitation, indirect or consequential loss or damage, or any loss or damage whatsoever arising from loss of data or profits arising out of, or in connection with, the use of this website.
This site may point to other Internet sites that may be of interest to you, however AnyChart does not endorse or take responsibility for the content on such other sites
Market data and News provided by and copyright RediNews, Incorporated.