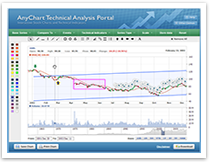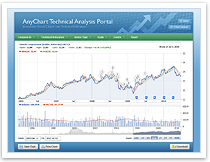
This Rich Internet Application shows how AnyChart Stock component can be used to create stock market analysis system.
This sample application provides the ability to use technical indicators built-in to the component to analyze of one sample stock. Besides these technical analysis options, there is an option to compare different companies stock quotations using "Compare To" menu. For the ease of data representation and handling user has abilities to change series display type, switch between logarithmic and linear axis scales and display significant events on the plot.